
Mac Network Monitoring: Essential Setup Checklist
Network Management
May 26, 2025
Effortlessly monitor your Mac's network performance and security with this comprehensive setup checklist and tool recommendations.

Want to monitor your Mac's network efficiently? Here's the quick guide you need.
Managing your Mac's network performance and security can seem complex, but it doesn’t have to be. Whether you’re troubleshooting slow speeds, tracking data usage, or securing your connection, this checklist simplifies the process.
Key Steps to Get Started:
Use Built-in Tools: Leverage macOS utilities like Activity Monitor and Wireless Diagnostics to track network activity and troubleshoot issues.
Adjust System Settings: Enable the macOS firewall, prioritize reliable network connections (like Ethernet), and configure privacy settings for secure monitoring.
Install Third-Party Tools: Apps like Little Snitch (traffic control), Wireshark (packet analysis), and PeakHour (real-time monitoring) enhance your capabilities.
Run Performance Tests: Test internet speed, latency, and packet loss to identify bottlenecks and ensure your ISP delivers expected performance.
Advanced Monitoring: Set up SNMP for enterprise-level monitoring, automate checks with scripts, and enable secure remote access for flexibility.
Quick Comparison of Tools:
Tool | Purpose | Best For | Cost |
|---|---|---|---|
Activity Monitor | Track app bandwidth usage | Basic monitoring | Free (built-in) |
Wireless Diagnostics | Troubleshoot Wi-Fi issues | Home Wi-Fi troubleshooting | Free (built-in) |
Little Snitch | Control outgoing traffic | Privacy and security | Paid (from $45) |
Wireshark | Deep packet analysis | Advanced troubleshooting | Free (open-source) |
PeakHour | Real-time bandwidth tracking | Long-term performance trends | Paid ($12.99/year) |
Start with built-in tools for quick insights, and expand with third-party apps for deeper analysis and control. This approach ensures your Mac’s network stays fast, secure, and reliable.
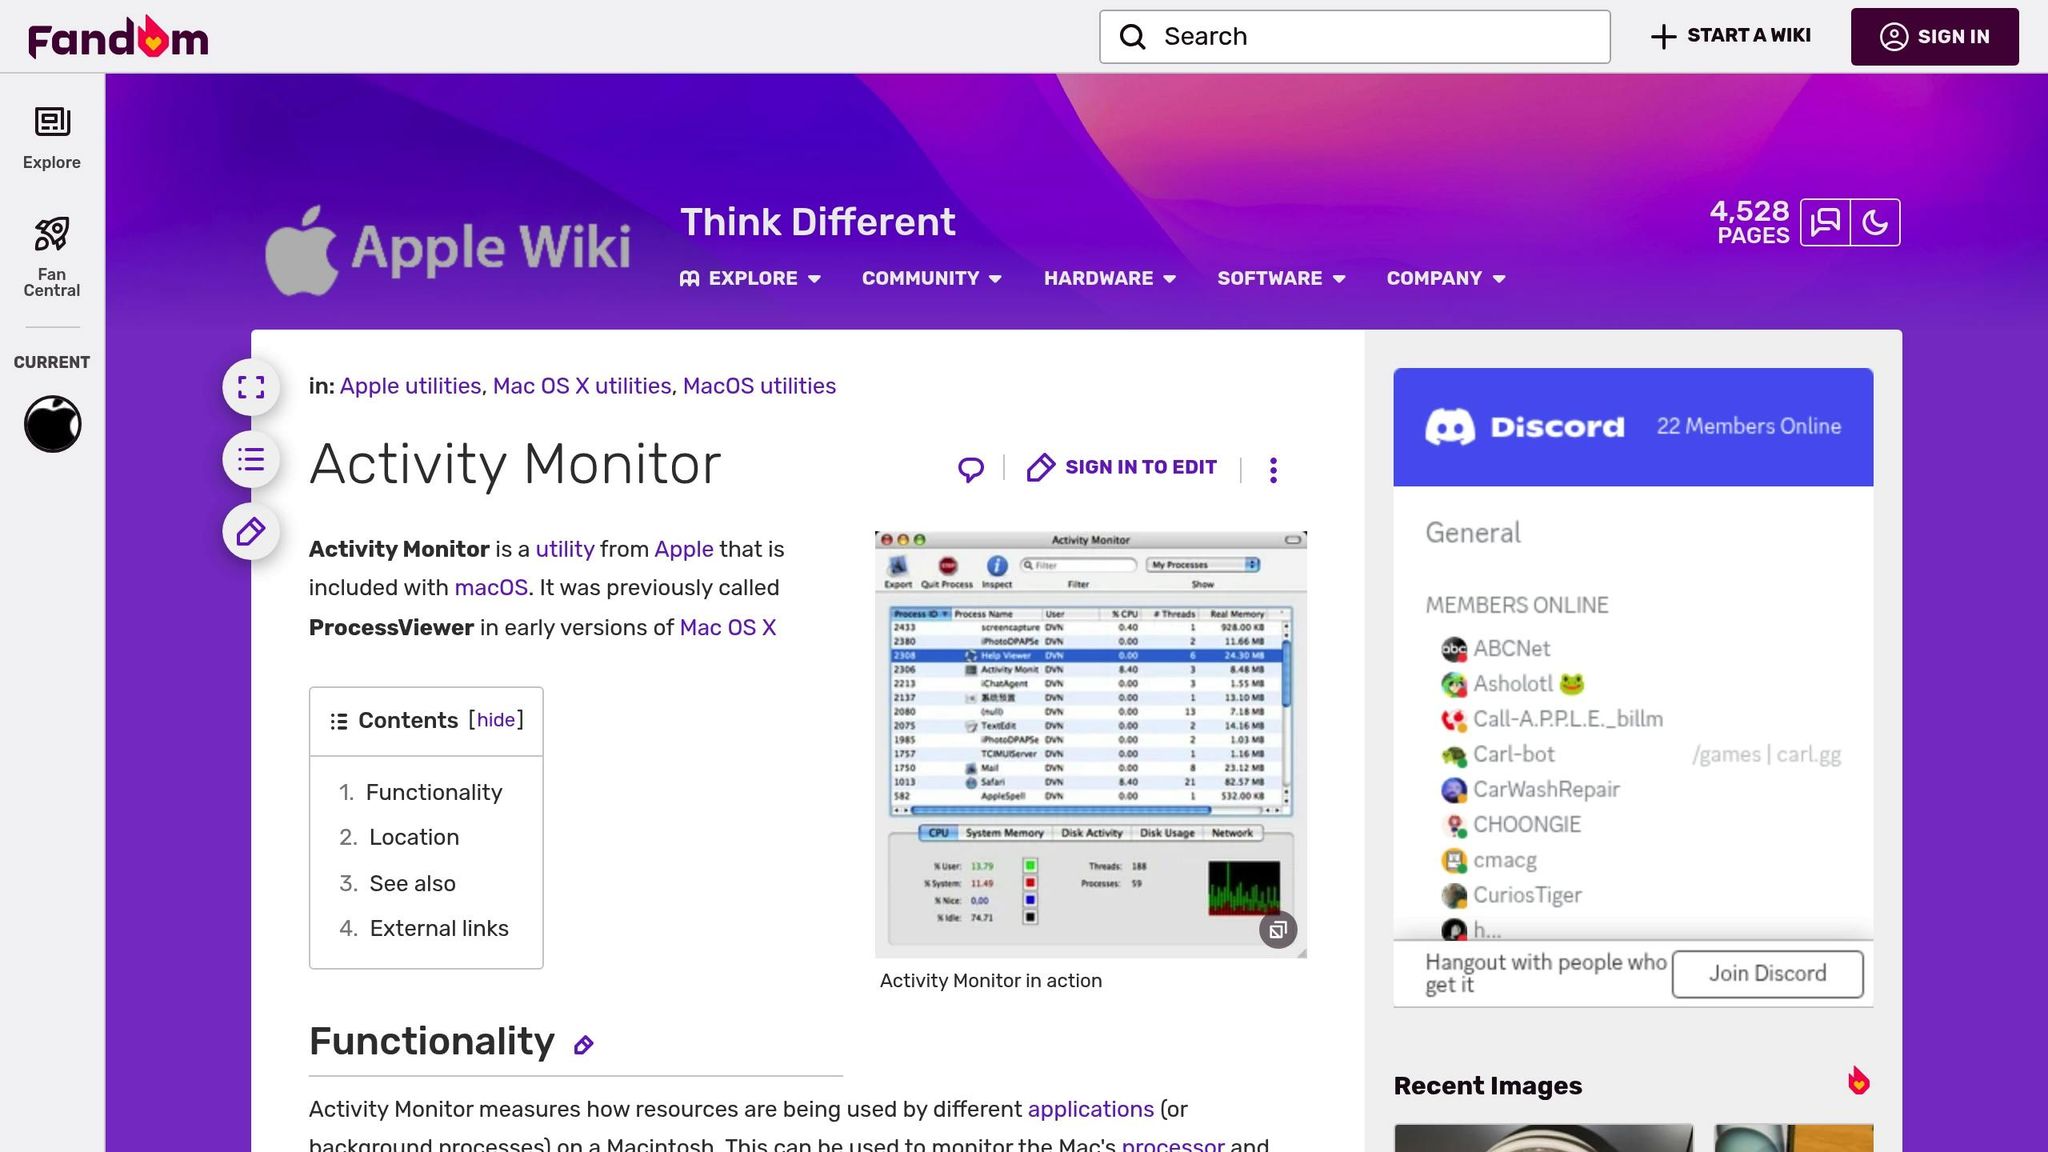
How to use Activity Monitor to view and manage the Active Processes on your macOS device
Preparing Your Mac for Network Monitoring
Setting up your Mac properly is essential for smooth and secure network monitoring. This ensures accurate results and avoids conflicts with other tools.
System Requirements and Compatibility
To use most network monitoring tools, you'll need administrative privileges. These privileges allow the tools to access low-level network data and install necessary components. Make sure you have the required permissions before proceeding.
Your macOS version is another key factor. While many tools work with recent macOS versions, some advanced features might only function on specific system versions. Always review the system requirements for each tool to avoid compatibility issues.
If you're working with resource-heavy tools like Wireshark, ensure your Mac has sufficient RAM and storage to handle the workload. Additionally, for MacBooks, keep in mind that continuous monitoring can quickly drain the battery. Opt for lightweight tools to extend battery life during monitoring sessions.
Once you've confirmed your system's capabilities, it's time to adjust macOS settings for better security and network performance.
Configuring System Settings
Fine-tuning your Mac's system settings is crucial for both secure and accurate network monitoring.
Enable and Configure the macOS Firewall
The macOS firewall adds an essential layer of protection. To activate it, go to the Apple menu > System Settings, select Network in the sidebar, then click Firewall and turn it on. After enabling the firewall, configure its options to allow signed software to receive incoming connections while blocking unauthorized access. To further enhance security, enable stealth mode. This prevents your Mac from responding to network scans, a method often used by hackers to identify vulnerable devices.
Prioritize Network Services
If your Mac has multiple network interfaces like Wi-Fi, Ethernet, or USB tethering, prioritize the most reliable connection. Navigate to Apple menu > System Settings > Network to set the order. Place Ethernet at the top for its stability, followed by Wi-Fi.
Enable Internet Sharing
To monitor traffic across multiple devices, you can enable Internet Sharing. Go to Apple menu > System Settings > General > Sharing and turn on Internet Sharing.
Privacy and Security Considerations
Network monitoring tools often raise privacy concerns. To address this, only download software from official sources recommended by developers. Limit browser extensions to those that are absolutely necessary and come from trusted developers.
Apple’s OCSP service also plays a role in privacy by using HTTPS encryption. This ensures that only Apple knows which applications you are running.
Using Built-in macOS Tools for Network Monitoring
macOS includes a suite of network monitoring tools that are ready to use without any downloads or extra purchases. These utilities offer detailed insights into your network activity and can help you troubleshoot connectivity issues.
Activity Monitor for Network Data
Activity Monitor is your go-to tool for checking network usage on your Mac. To access it, navigate to Applications > Utilities > Activity Monitor, then click the Network tab. Here, you can view real-time transfer rates and sort by Sent Bytes or Data to quickly identify which apps are using the most bandwidth.
At the bottom of the window, you'll find key metrics like Packets in, Packets out, Data received/sec, and Data sent/sec. These values give you a snapshot of your current upload and download activity. Pay close attention to these numbers if you suspect large data transfers.
Pro tip: If you're using Safari, monitor the "Safari Networking" process instead of the Safari app itself for accurate data usage. You can also narrow your focus by typing a specific process name in the search bar to track individual applications.
To tailor the tool to your needs, use View > Columns to add more network metrics or select View > Dock Icon > Show Network Usage to display activity directly in your Dock. Additionally, the graph at the bottom can toggle between Packets and Data views using the menu above it.
For more advanced diagnostics, macOS also offers powerful Terminal commands.
Terminal Commands for Network Diagnostics
Terminal provides precise tools for network troubleshooting. These commands let you dig deeper into network behavior and performance.
Basic Network Information and Connectivity Testing
You can check your primary network connection using commands like ifconfig en0 | grep inet or ipconfig getifaddr en0. To find your public IP address, run curl ifconfig.me or curl ipecho.net/plain. Test basic connectivity with ping www.google.com, or limit the test to five packets using ping -c 5 www.google.com. For a detailed route trace, use traceroute www.google.com to see the path your packets take.
Network Statistics and Connections
The netstat command provides details on active connections and routing. Use netstat -an to list all active connections, netstat -r to view your routing table, and netstat -i for interface statistics. These commands can help you spot unusual activity or routing issues.
DNS and Advanced Diagnostics
For DNS lookups, try dig www.google.com for detailed results or dig +short www.google.com for a simpler output. Reverse DNS lookups can be done with dig -x 8.8.8.8. To identify which processes are using specific ports, run sudo lsof -i for all connections or sudo lsof -i :80 for port 80.
Network Maintenance Commands
If you're experiencing issues, clear your DNS cache with sudo dscacheutil -flushcache; sudo killall -HUP mDNSResponder. For more severe problems, reset your network interface using sudo ifconfig en0 down followed by sudo ifconfig en0 up.
For Wi-Fi-specific troubleshooting, macOS provides the Wireless Diagnostics tool.
Wireless Diagnostics Tool
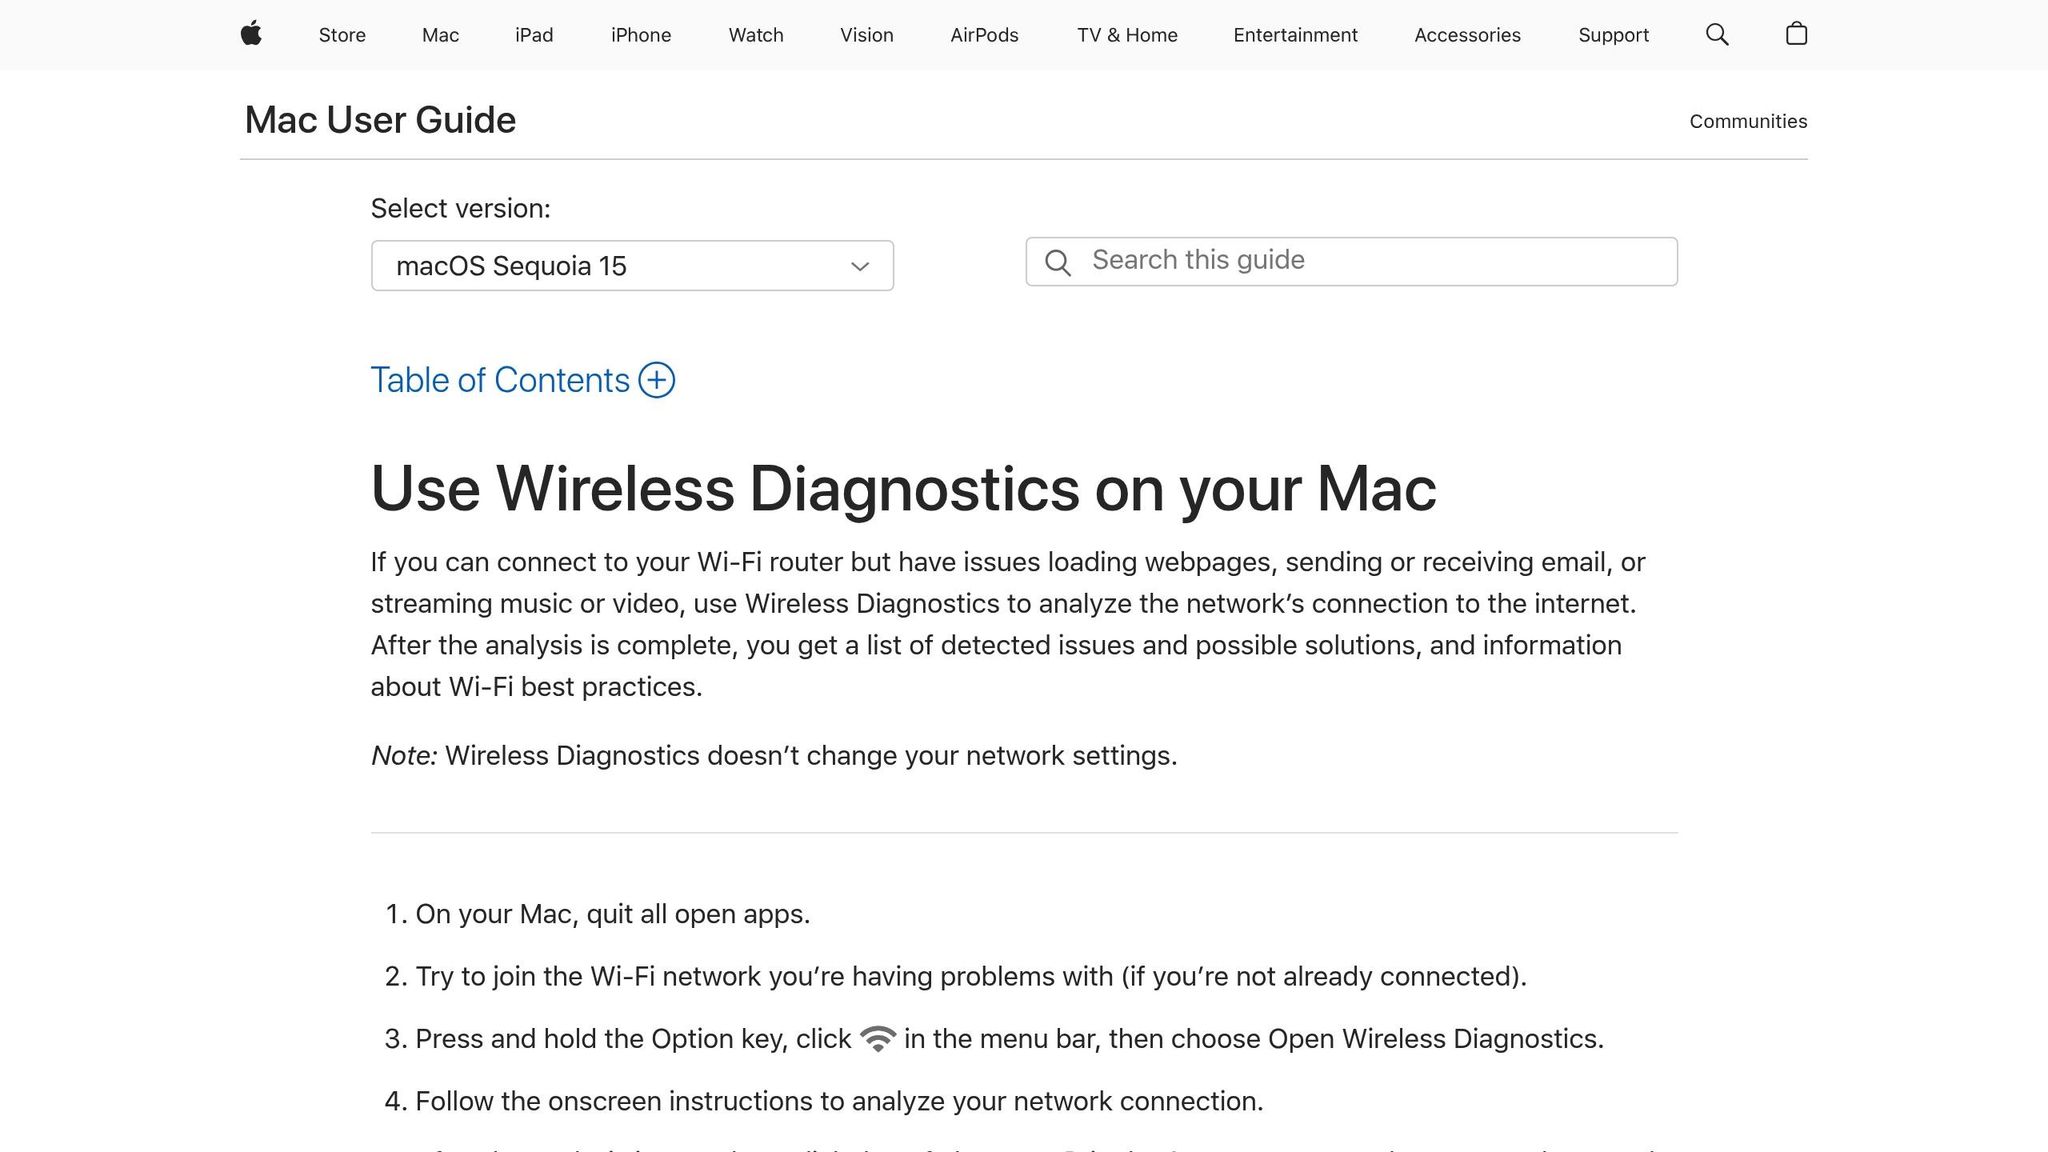
The Wireless Diagnostics tool is a built-in utility designed to analyze and troubleshoot Wi-Fi issues, such as slow loading pages, email problems, or streaming interruptions.
Accessing Wireless Diagnostics
To open this tool, close all other applications and connect to the problematic Wi-Fi network. Hold the Option key, click the Wi-Fi icon in the menu bar, and select "Open Wireless Diagnostics". The tool will scan for issues, suggest solutions, and provide guidance on improving your Wi-Fi setup.
Advanced Diagnostic Features
Wireless Diagnostics includes several advanced tools under the Window menu. The Scan feature lists nearby networks, showing signal strength, channels, and noise levels. It also recommends channels to reduce interference. The Performance tool displays real-time graphs of signal strength and noise, helping you assess connection quality.
For ongoing issues, use the Monitor my Wi-Fi connection feature to track performance over time. The Info tool provides detailed network data such as MAC addresses and channel information. For packet-level analysis, the Sniffer tool captures Wi-Fi traffic and saves it to a .wcap file for review.
Diagnostic Reports and Logs
After running diagnostics, click the Info buttons in the Summary pane for detailed explanations of identified issues. The tool also generates a compressed diagnostic file, which is useful for IT support or network administrators. To locate this file, press Command+Space, type "Go to Folder", enter /var/tmp, and look for files starting with WirelessDiagnostics_ and ending with .tar.gz.
The Logs feature records network activity in your system log file, while Sidecar offers visual data on latency, failure rates, and channel congestion. These tools allow you to analyze your wireless network in detail, all without needing third-party software.
Adding Third-Party Monitoring Tools
macOS comes with some excellent built-in utilities, but third-party tools can take your network monitoring to the next level. These tools offer features like traffic filtering, deep packet analysis, and real-time monitoring that complement macOS's native capabilities. Let’s dive into how to install and configure some of the most popular options to give you greater control over your network.
Setting Up Little Snitch for Traffic Control
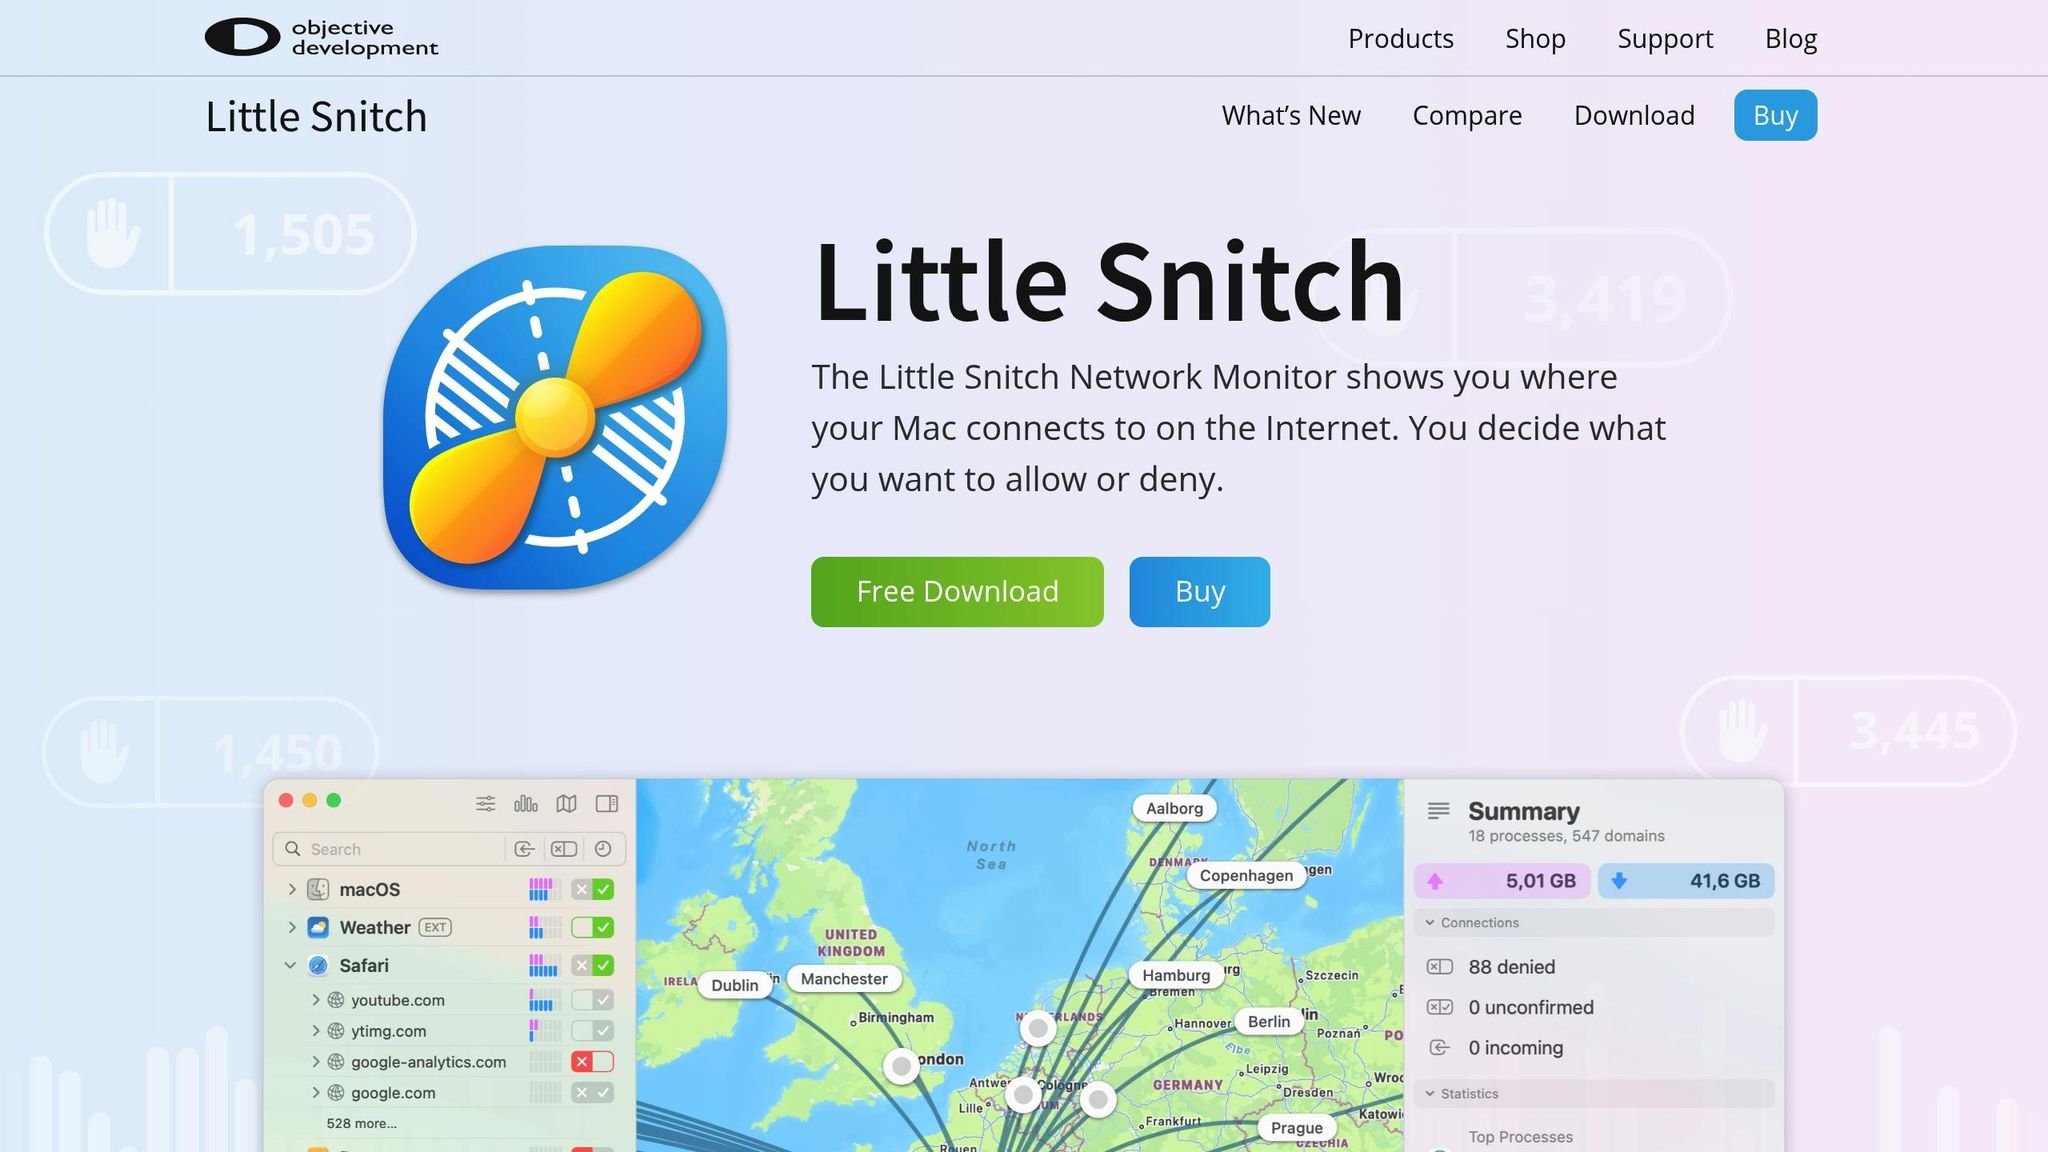
Little Snitch is a powerful tool that lets you monitor and control outgoing network traffic, giving you the ability to decide which apps can connect to the internet.
How to Install Little Snitch
To get started, download the app, drag it into your Applications folder, and grant the necessary system permissions in System Settings > Privacy & Security. During setup, macOS will prompt you to allow Little Snitch to filter network content - this step is crucial for the app to work properly.
Customizing and Managing Rules
Once installed, you can configure Little Snitch to suit your needs. For example, turning on Silent Mode allows all connections temporarily while logging them, so you can review and create rules later without constant pop-ups during setup. The app also includes pre-configured rule groups for macOS and iCloud services, which you can enable if you trust Apple's system connections. Want to block ads or malicious sites? Add blocklists to deny connections to known ad servers, tracking domains, or malware sources.
Little Snitch provides detailed insights into your network activity, such as data usage, server locations, and the protocols being used. To keep things running smoothly, periodically review and remove any outdated or unnecessary rules.
Installing Wireshark for Packet Analysis

Wireshark is an open-source packet analyzer that’s perfect for troubleshooting complex network issues and understanding how data moves through your network.
Installation Steps
To install Wireshark on macOS, download the official package from the Wireshark website and install the main application bundle. You’ll also need to install the ChmodBPF package, which provides the necessary permissions to capture live network traffic. Without this component, macOS’s security settings will block live packet capturing, although you can still analyze saved packet files.
Using Wireshark Effectively
Wireshark captures a large volume of data, so it’s a good idea to use capture filters before starting a session. These filters let you focus on specific protocols, IP addresses, or ports, reducing unnecessary noise. After capturing data, apply display filters to hone in on the packets you want to analyze. Wireshark’s color-coded interface helps you quickly identify traffic patterns and packet types. You can also use the Follow Stream feature to trace entire conversations between devices, making it easier to understand the context of the data flow.
Wireshark supports various types of networks, including Ethernet, Bluetooth, and wireless, making it a versatile tool for many scenarios.
Using PeakHour for Real-Time Monitoring

PeakHour is a user-friendly tool that provides real-time network monitoring through a sleek, customizable dashboard. It’s a great addition for anyone who wants a clear picture of their bandwidth usage and long-term network trends.
Key Features
PeakHour offers real-time bandwidth monitoring directly from your menu bar, with support for advanced protocols like SNMP and UPnP. It allows you to track bandwidth usage, verify your ISP’s performance, and analyze historical trends. Its broad protocol support ensures compatibility with a variety of network devices, making it suitable for both home users and professionals.
Pricing Options
PeakHour is available as either an annual subscription for $12.99 or a one-time purchase for $44.95. Both options include full access to all features, along with perks like macOS dark mode integration, iCloud sync, and detailed logging. Plus, it supports Family Sharing, so multiple Mac users in the same household can benefit from a single purchase. With a 4.4 out of 5 rating on the Mac App Store, it’s a well-regarded and cost-effective choice for network monitoring.
Setting Up Advanced Monitoring Protocols
Once you've got the hang of basic network monitoring using built-in tools and third-party apps, it's time to step up your game. Advanced protocols can turn your Mac into a central hub for managing and monitoring networks, which is especially useful for professionals overseeing multiple devices or networks. These methods build on basic monitoring and extend your capabilities to handle enterprise-level tools and remote management.
Setting Up SNMP for Enterprise Monitoring
The Simple Network Management Protocol (SNMP) is a key tool for gathering performance data from network devices like routers, switches, and servers. The good news? macOS already includes SNMP, so you can get started without much hassle.
Configuring SNMP on macOS
Before diving in, make sure to back up the /etc/snmp/snmpd.conf file. This way, you can always revert to the original settings if needed.
If you're using an Apple Silicon Mac, remember that Homebrew installs packages in /opt/homebrew/ instead of the traditional /usr/local/. Adjust file paths accordingly when working with SNMP components.
To configure SNMP, edit the snmpd.conf file. Set read-only access for SNMP v1/v2c and restrict queries to specific network segments. Avoid the default "public" community string - opt for something unique and hard to guess.
Starting the SNMP Service
Once your configuration is ready, start the SNMP daemon and set it to launch automatically when your system boots. As RangerRick, a network expert, explains:
"net-snmp ships with it and works just fine. Set up the configs in
/etc/snmplike you would for anything else, and then do:sudo launchctl load -w /System/Library/LaunchDaemons/org.net-snmp.snmpd.plist”.
For added security, block external SNMP requests in your firewall unless absolutely necessary. This ensures only local network monitoring is allowed, reducing the risk of unauthorized access.
Enabling Remote Monitoring Access
Remote monitoring lets you check on your network no matter where you are. However, security should always be your top priority when enabling remote access.
Setting Up Secure Remote Access
To enable Remote Management, go to System Preferences > Sharing on the Mac you want to monitor. Keep in mind, as noted in macOS documentation, “Enabling remote management doesn’t give you access to the computer, but it does let you define who has access”. This means you’re setting up controlled access rather than leaving the system wide open.
For macOS 10.14 and newer, Screen Sharing defaults to view-only mode, adding an extra layer of security. If you need full control, you’ll have to configure this explicitly through System Preferences.
Strengthening Security
Use strong, unique passwords for VNC connections.
Add a VPN for an extra layer of protection.
Enable multi-factor authentication if the software supports it.
Most remote desktop tools provide AES 256-bit encryption for secure sessions. To stay on top of things, regularly review access logs to spot any unauthorized attempts. This kind of auditing gives you clear visibility into who accessed the system and when.
Once you've set up secure remote access, automate routine checks to keep your network running smoothly.
Creating Automated Checks with Custom Scripts
Automation is a game-changer for network monitoring. Instead of sporadic manual checks, automated scripts can help you identify and address issues before they escalate. On macOS, Python, Bash, and PowerShell are all great options for writing these scripts.
Building Effective Monitoring Scripts
Choose the scripting language that best fits your needs. Python is ideal for handling complex data and APIs, while Bash is perfect for simpler tasks like running system commands or managing files.
Break your scripts into smaller, reusable modules. This makes it easier to maintain and adapt them as your needs evolve. Don’t forget to include error handling to deal with unexpected network issues.
Boosting Script Performance
When monitoring multiple devices, efficiency is key. Use techniques like parallel processing, multithreading, or asynchronous programming to avoid delays caused by sequential checks.
Take advantage of tools and libraries instead of starting from scratch. For example:
The
netstatcommand provides detailed network usage data.
Document your scripts thoroughly and use Git for version control. Implement unit testing during development to catch bugs early, and update your scripts regularly to keep up with changes in your network environment.
To enhance your setup, consider using tools like PeakHour, which supports SNMP. Pairing its real-time monitoring features with your custom scripts can give you a well-rounded solution, combining instant alerts with long-term trend analysis.
Testing Network Performance
Checking your network's performance helps identify bottlenecks, confirm your ISP's speed claims, and ensure everything runs smoothly. These tests complement your monitoring setup by providing insight into how your network performs under real-world conditions.
Running Internet Speed Tests
Internet speed tests are a straightforward way to gauge your network's performance. Tools like Speedtest measure key metrics such as download speed, upload speed, ping, jitter, and packet loss. To get accurate results, close any bandwidth-heavy activities like downloads or video calls before running the test. Also, check that your router’s Quality of Service (QoS) settings aren’t limiting speeds artificially. While Speedtest automatically connects to a nearby server with low ping, it’s a good idea to test multiple servers. This approach can give you a broader picture of your network’s performance, including its suitability for web browsing, gaming, video streaming, and video conferencing.
Testing Latency and Packet Loss
Speed tests are great for measuring bandwidth, but they don’t tell the whole story. Latency and packet loss are equally important for understanding the reliability of your connection. Latency, or ping, measures how quickly data travels between your device and a server, typically reported in milliseconds (ms). On macOS, you can use the Terminal to run a basic ping test - just type ping followed by an IP address or domain name. This will give you insights into both latency and packet loss. For a more visual and detailed analysis, tools like PingPlotter can be helpful. By measuring latency, jitter, and packet loss, you can evaluate your connection’s stability. Advanced tools like MTR and interface counter checks can also help identify problematic network hops.
Collecting Historical Data for Trends
While real-time tests are helpful, tracking historical data reveals long-term patterns and recurring issues. On macOS, the built-in Activity Monitor shows real-time network stats, such as packets sent and received, but it doesn’t store this data for future analysis. For a deeper dive, tools like PeakHour can continuously monitor your network, logging detailed performance data over time. This allows you to spot bandwidth trends, diagnose recurring problems, and see how performance fluctuates throughout the day or week. Historical data is especially useful for troubleshooting intermittent issues and verifying your ISP’s performance. Command-line tools like tcpdump and nettop can also log network activity for later review.
Combining real-time testing with historical data gives you a complete picture of your network’s health. This approach ensures you can maintain top-notch performance and quickly resolve any issues that arise.
Conclusion: Key Points for Network Monitoring Success
Monitoring your Mac's network effectively means blending built-in utilities with specialized third-party tools. While Activity Monitor and Terminal commands are great for basic diagnostics, they fall short when it comes to real-time monitoring, in-depth analysis, or long-term tracking.
To cover all your bases, a multi-tool strategy works best. Use macOS's built-in tools for quick checks, and pair them with third-party apps like Little Snitch, Wireshark, and PeakHour for more advanced monitoring and analysis. As your needs expand, consider incorporating advanced protocols to enhance security and automate your processes.
For more complex setups, protocols like SNMP and custom automation scripts become invaluable. These tools enable remote access and automated health checks, helping you catch and address issues before they disrupt your workflow.
Regular testing is also key to staying ahead of potential problems. Speed tests ensure your ISP is delivering on its promises, while latency and packet loss tests can uncover hidden stability issues. By collecting and analyzing historical data, you can spot trends and patterns that make managing your network much easier.
One challenge with macOS is its lack of centralized logging for both the network and operating system, which complicates detailed event monitoring. This makes third-party tools indispensable for achieving full visibility. By combining these tools with routine testing, you can keep your Mac's network running smoothly and efficiently.
FAQs
What are the benefits of using third-party network monitoring tools like Little Snitch and Wireshark on macOS?
Using third-party network monitoring tools like Little Snitch and Wireshark on macOS can give you a lot of control and visibility over your network activity. Here’s how they can help:
Stronger Security: Little Snitch works as a robust firewall, letting you monitor and block any unauthorized outgoing connections. This means you have more control over your data and better protection for your privacy.
Live Network Monitoring: Both tools provide real-time insights into your network. Little Snitch shows active connections in an easy-to-understand interface, while Wireshark captures and analyzes packets, helping you quickly pinpoint and resolve issues.
In-Depth Traffic Analysis: With Wireshark, you can dig deep into your network traffic. Its advanced filtering options make troubleshooting easier and can help you fine-tune your network's performance.
Whether you're a professional or just someone who wants more control over their Mac's network, these tools are excellent for improving security, diagnosing connectivity issues, and managing network activity effectively.
How can I securely set up remote access for network monitoring on my Mac?
To ensure your Mac's network monitoring setup remains secure while allowing remote access, consider these key practices:
Enable strong authentication: Protect your remote access tools by setting up two-factor authentication (2FA). This adds an extra layer of protection beyond just a password.
Keep everything updated: Regularly update both macOS and any remote access tools to safeguard against potential security vulnerabilities.
Turn on the macOS firewall: Configure your firewall to block unauthorized connections while still permitting legitimate remote access.
Use a VPN: A Virtual Private Network encrypts your internet traffic, ensuring your remote connections are both secure and private.
By following these steps, you can monitor your Mac's network remotely without sacrificing security.
How can I automate network monitoring on macOS to quickly detect and address issues?
To keep an eye on your network activity and tackle potential issues on macOS, you can rely on a mix of built-in tools and third-party apps designed for seamless monitoring. Little Snitch is a solid choice for managing outgoing network connections, offering real-time alerts so you can monitor and control your traffic with ease. For a more comprehensive view, you can turn to Activity Monitor or even create custom Automator scripts to schedule regular checks and automate fixes for recurring network problems. These tools help you stay on top of your Mac's network performance, ensuring smooth and efficient operation.